Owners
Revenue, margin, collection and utilisation per branch, compared side by side.
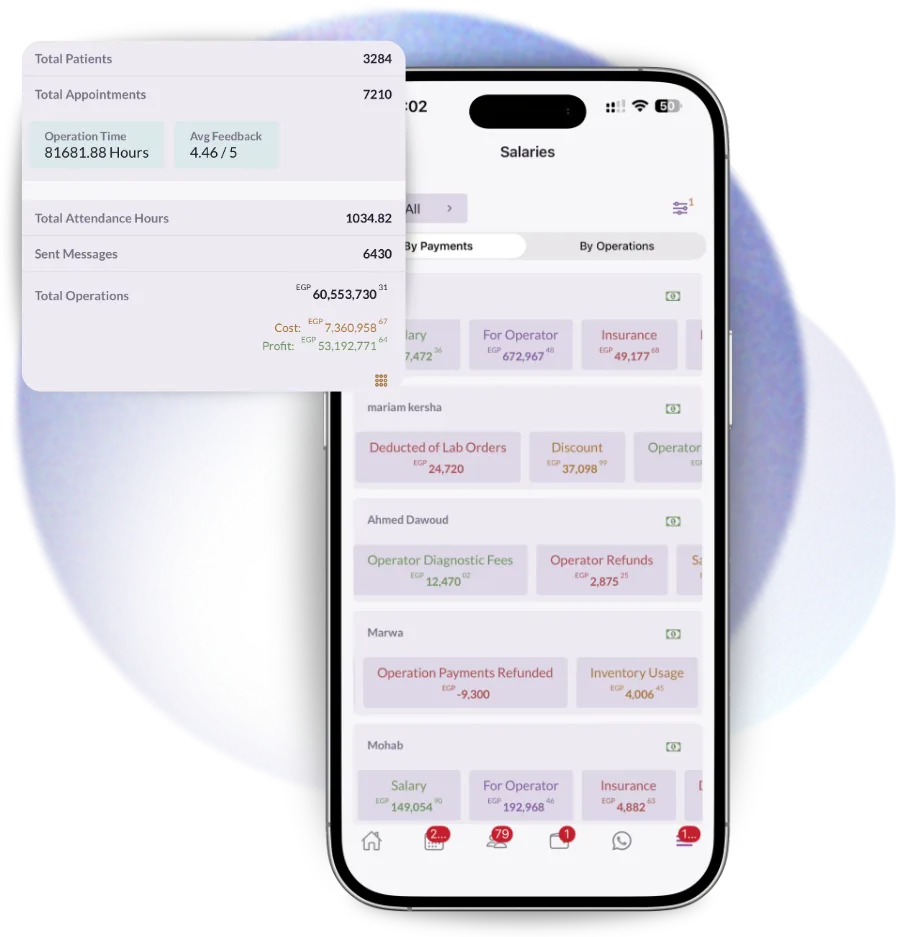
Reports that are already written when the month closes, because every one of them is built from the treatment, the invoice and the doctor that produced it. Financial, clinical, marketing and staff performance in the same place, per branch.
Income, collection, discounts, tax and outstanding balances, each traceable to the invoice and the operation behind it. No report is assembled by hand, so no two reports disagree.
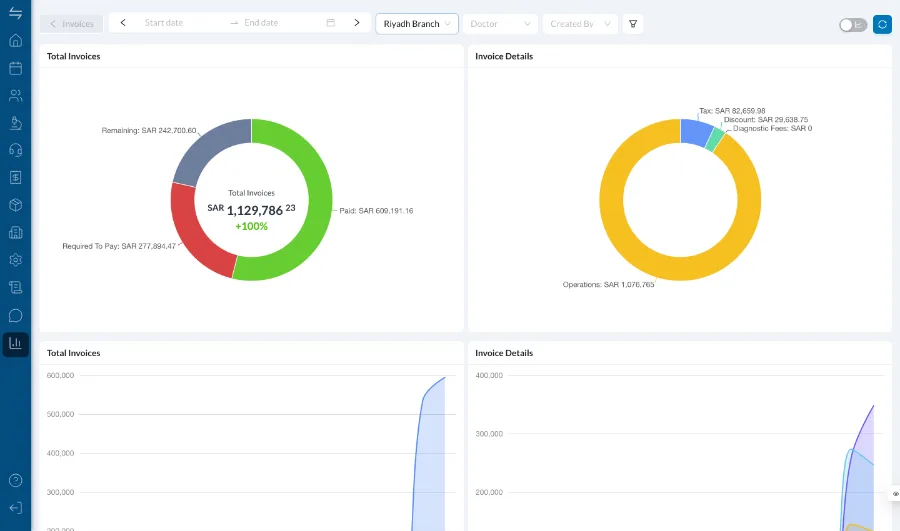
What was actually done, by whom, and how much of it was completed. Operations by procedure and by doctor sit beside cancellations and no-shows, which is where most lost capacity is.
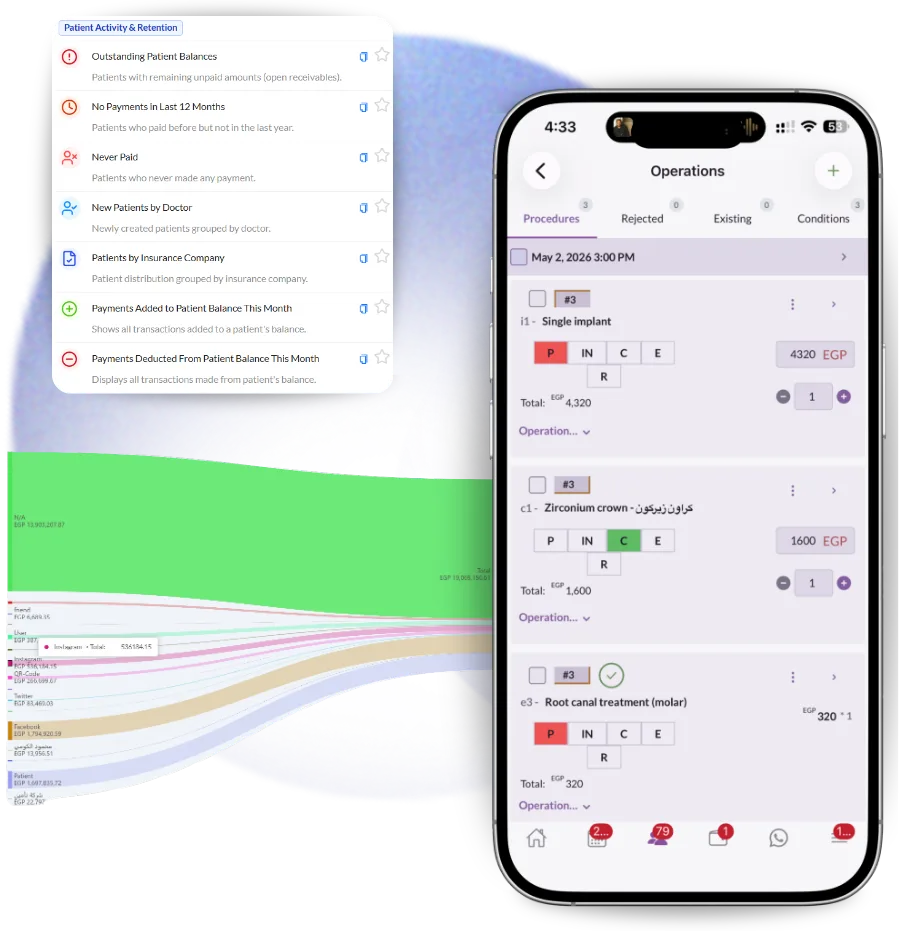
Where patients come from, which ones come back, and which ones have not been seen in a year. The source travels from the first enquiry to the invoice, so channel reporting is about revenue rather than clicks.
Reporting fails in clinics when it produces a number nobody can act on, or one they do not trust.
Revenue, margin, collection and utilisation per branch, compared side by side.
Where the day is leaking: no-shows, unbilled treatment, stalled claims.
Reports that reconcile to the ledger because they are built from the same records.
Most clinics can produce a number. Far fewer can produce the same number twice.
Runs in your browser, no sign-up, and nothing about your patients leaves it.
No sign-up and no form: the file downloads directly.
Gross and net production, collections, production per clinical hour and treatment acceptance, per dentist and month.
Download free ExcelOpen, booked and treated hours per chair each week, hours lost to no-shows, utilisation against target and production per hour.
Download freeFinancial reports including income, collection rate, discounts, tax and receivables; clinical reports on operations by procedure and doctor; patient reports on sources, retention and outstanding balances; staff performance; inventory consumption; and forecasting against actuals.
Yes. Every report filters by branch, and owners can put branches side by side while a branch manager sees only their own.
Yes, to CSV and Excel, and they can be printed. Filters and date ranges apply before exporting so you send the slice you meant to.
They are built from the same invoices, payments and expenses the finance module uses, so there is one set of records rather than a reporting copy that drifts.
Live. A procedure completed this morning is in the report this morning, which is what makes the dashboard usable during the day rather than only at month-end.
See today's appointments, revenue, no-shows and operations at a glance. Dentolize's dynamic dashboard gives dental…
Read moreTrack payments, invoices, expenses and treasury in real time. Dentolize gives dental clinics full financial…
Read moreTrack attendance, measure staff performance, control permissions and manage several branches. Dentolize gives clinic…
Read moreThirty minutes on how your clinic actually runs, not a generic slideshow. We will call you within 24 hours.