Periodontal charting form
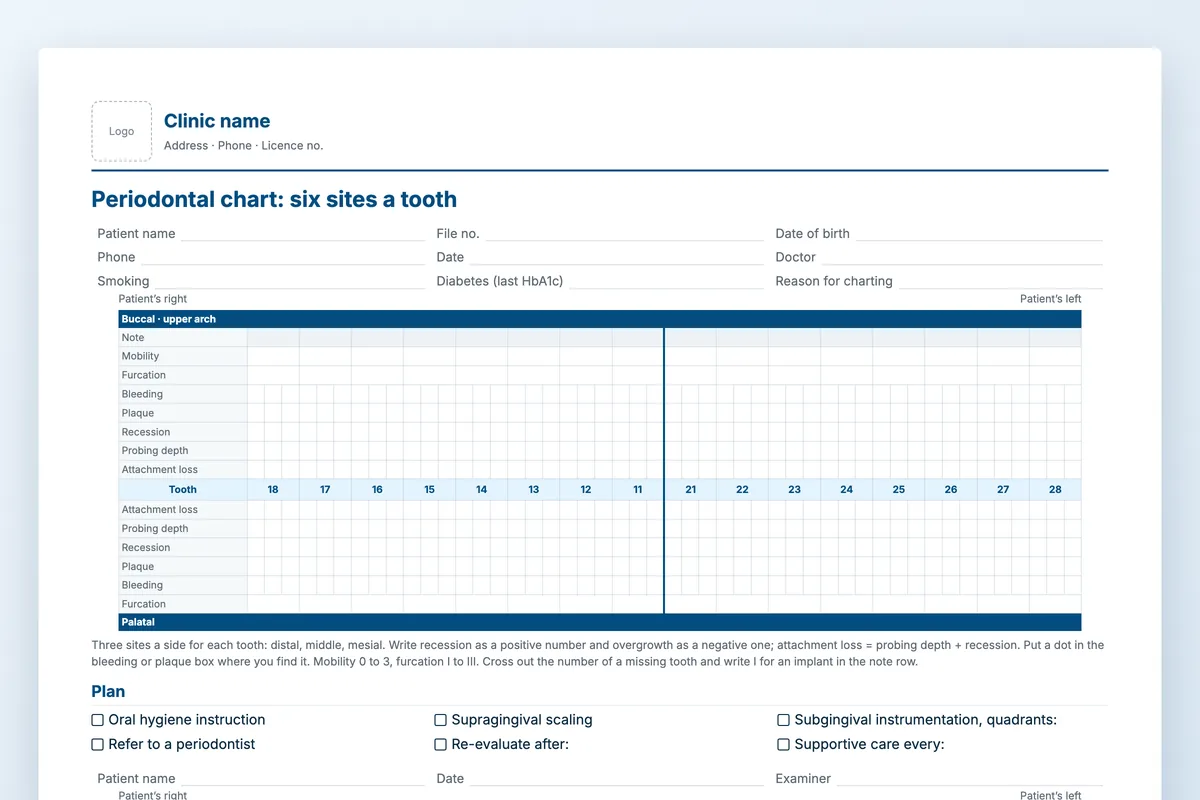
A full six-point perio chart on two landscape pages: the upper arch with buccal above the numbers and palatal below, the lower arch the same way round, then the scores that tell you whether treatment worked.
Download
- Word · English.docx · 41 KB
- PDF · English.pdf · 276 KB
- Word · Arabic.docx · 42 KB
- PDF · Arabic.pdf · 104 KB
FreeNo sign-upDownloads directly
Rather fill it in on screen? Printable dental chart
What is on the two pages
| Upper arch | Mobility, furcation, bleeding, plaque, recession, probing depth and attachment loss on the buccal side; the same five site rows on the palatal side, three sites per tooth on each. |
|---|---|
| Lower arch | Lingual rows above the tooth numbers and buccal below, in FDI order from 48 to 38, patient’s right on your left. |
| Indices | Sites bleeding on probing, surfaces with plaque, sites 4 to 5 mm and 6 mm or deeper, furcation and mobility counts and mean probing depth, at baseline and at re-evaluation, each as a count, a total and a percentage. |
| Diagnosis and plan | Stage, grade and extent in the 2017 classification, then hygiene instruction, scaling, subgingival instrumentation by quadrant, referral, re-evaluation and supportive care. |
How to use it
Print it landscape
The PDF is landscape A4. In Word the page is already set landscape; add your letterhead at the top.
Chart one side at a time
Probe the buccal sites tooth by tooth, then the palatal or lingual. Recession is a positive number, overgrowth negative; attachment loss is the two added.
Count before you diagnose
Fill the index table from the dots and numbers, then stage and grade.
Chart again at re-evaluation
Use a fresh copy and fill the re-evaluation column, so the two scores sit side by side.
Who it is for
General dentists who find a BPE code 3 or 4, hygienists and therapists running non-surgical periodontal treatment, and periodontists who want a printable chart with the same rows as their software. It also serves for implant patients with a history of periodontitis, where pocketing around natural teeth is the first warning.
Read next
Dental chart
Chart treatments, track conditions and record operations digitally. Dentolize's interactive dental chart replaces paper with a fast, visual one.
Read more From the blogManaging dental patient records digitally
What belongs in a patient file, how to structure it so anyone can pick a case up, and what digital archiving changes.
Read moreMore free files
Questions
Why six sites a tooth?
Distal, middle and mesial on each side. A BPE gives the worst site in a sextant; a six-point chart shows where the pockets are, which you need to plan instrumentation and to see change at re-evaluation.
How do I score bleeding and plaque?
A dot in the box for each site that bleeds or carries plaque. Count the dots, divide by the sites charted and you have the percentage for the index table.
Does it follow the 2017 classification?
The diagnosis lines use its stage, grade and extent. Which stage applies remains your clinical judgement; the form records it.
Can I use it for implants?
Yes. Write I in the note row over the implant and probe it like a tooth. The implant treatment record has its own maintenance table as well.
Perio charts you can compare at a glance
In Dentolize the perio chart is part of the patient file, so this visit’s pockets sit next to the last ones and the recall is booked from the same screen. Thirty minutes on your own clinic.